warning KDMC resources are archived here. We are no longer updating this site.
Which open government and open data projects are right for your community? Attend this webinar to find out.
Want to get your hands dirty with data and start producing your own data visualizations
The Billion Dollar O-Gram
WNYC Snow Map
Solar Roof Map
Graphing the Gestures of Presidential Candidates During Debates
New York Times Oil Spill Tracker
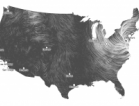
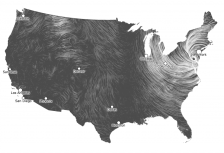
Live Wind Currents Map
Visualization of causes of death in Crimean War
Tohuku Earthquake Before and After
FiveThirtyEight, a blog which aggregates and visualizes political polls
IsBarackObamaPresident/IsMittRomney President, a whimsical data visualization based on polls
Information Is Beautiful
Visualize This
Sunlight Foundation Data Visualization Tumblr
The Journalist's Learn-to-Code Resource Guide
Data.gov
World Health Organization
World Bank
ParisData
Ann Arbor Data Catalog
Datacatalogs.org
Many Eyes
BuzzData
Tableau Public
D3.js
Three Digital Revolutions: How Information Today is Woven into Our Lives.
Newspaper revenues and circulation, print and digital combined, continued to decline in 2015 while both cable and network TV enjoyed...
Anyone who dismisses or ignores this guide should not be working in journalism. The updated Diversity Style Guide is one...

![[Archived Webinar, May 2013] Open Data, Open Government, and Civic Participation: Five Projects Any Community Can Try](../../sites/default/files/imagecache/t2_thumb/feature%20logo_five%20projects-01.png)
![[Archived Virtual Class, January 2013] A Deeper Dive Into Data](../../sites/default/files/imagecache/t2_thumb/archived%20virtual_deeper%20dive%20into%20data-01.png)
![[Archived Webinar, November 2012] Three Digital Revolutions](../../sites/default/files/imagecache/t2_thumb/three%20digital%20revolutions_archived%20webinar-01.png)